How does your marriage compare to the Australian average?
A calm look at the real numbers from the 2024 Australian Bureau of Statistics release. Around 2 in 3 Australian marriages last, and the divorce rate is at its lowest in nearly 50 years.
Your details
For context only. Nothing is stored or shared.
Your comparison will appear here
Set your details, then tap the button.
The national picture
Australian Bureau of Statistics, 2024
47,216
Divorces in 2024 (down 3% on 2023)
2.1
Per 1,000 people aged 16+ (lowest since 1976)
13.2
Median years of marriage
47%
Of divorces involve children under 18
How divorce has changed over time
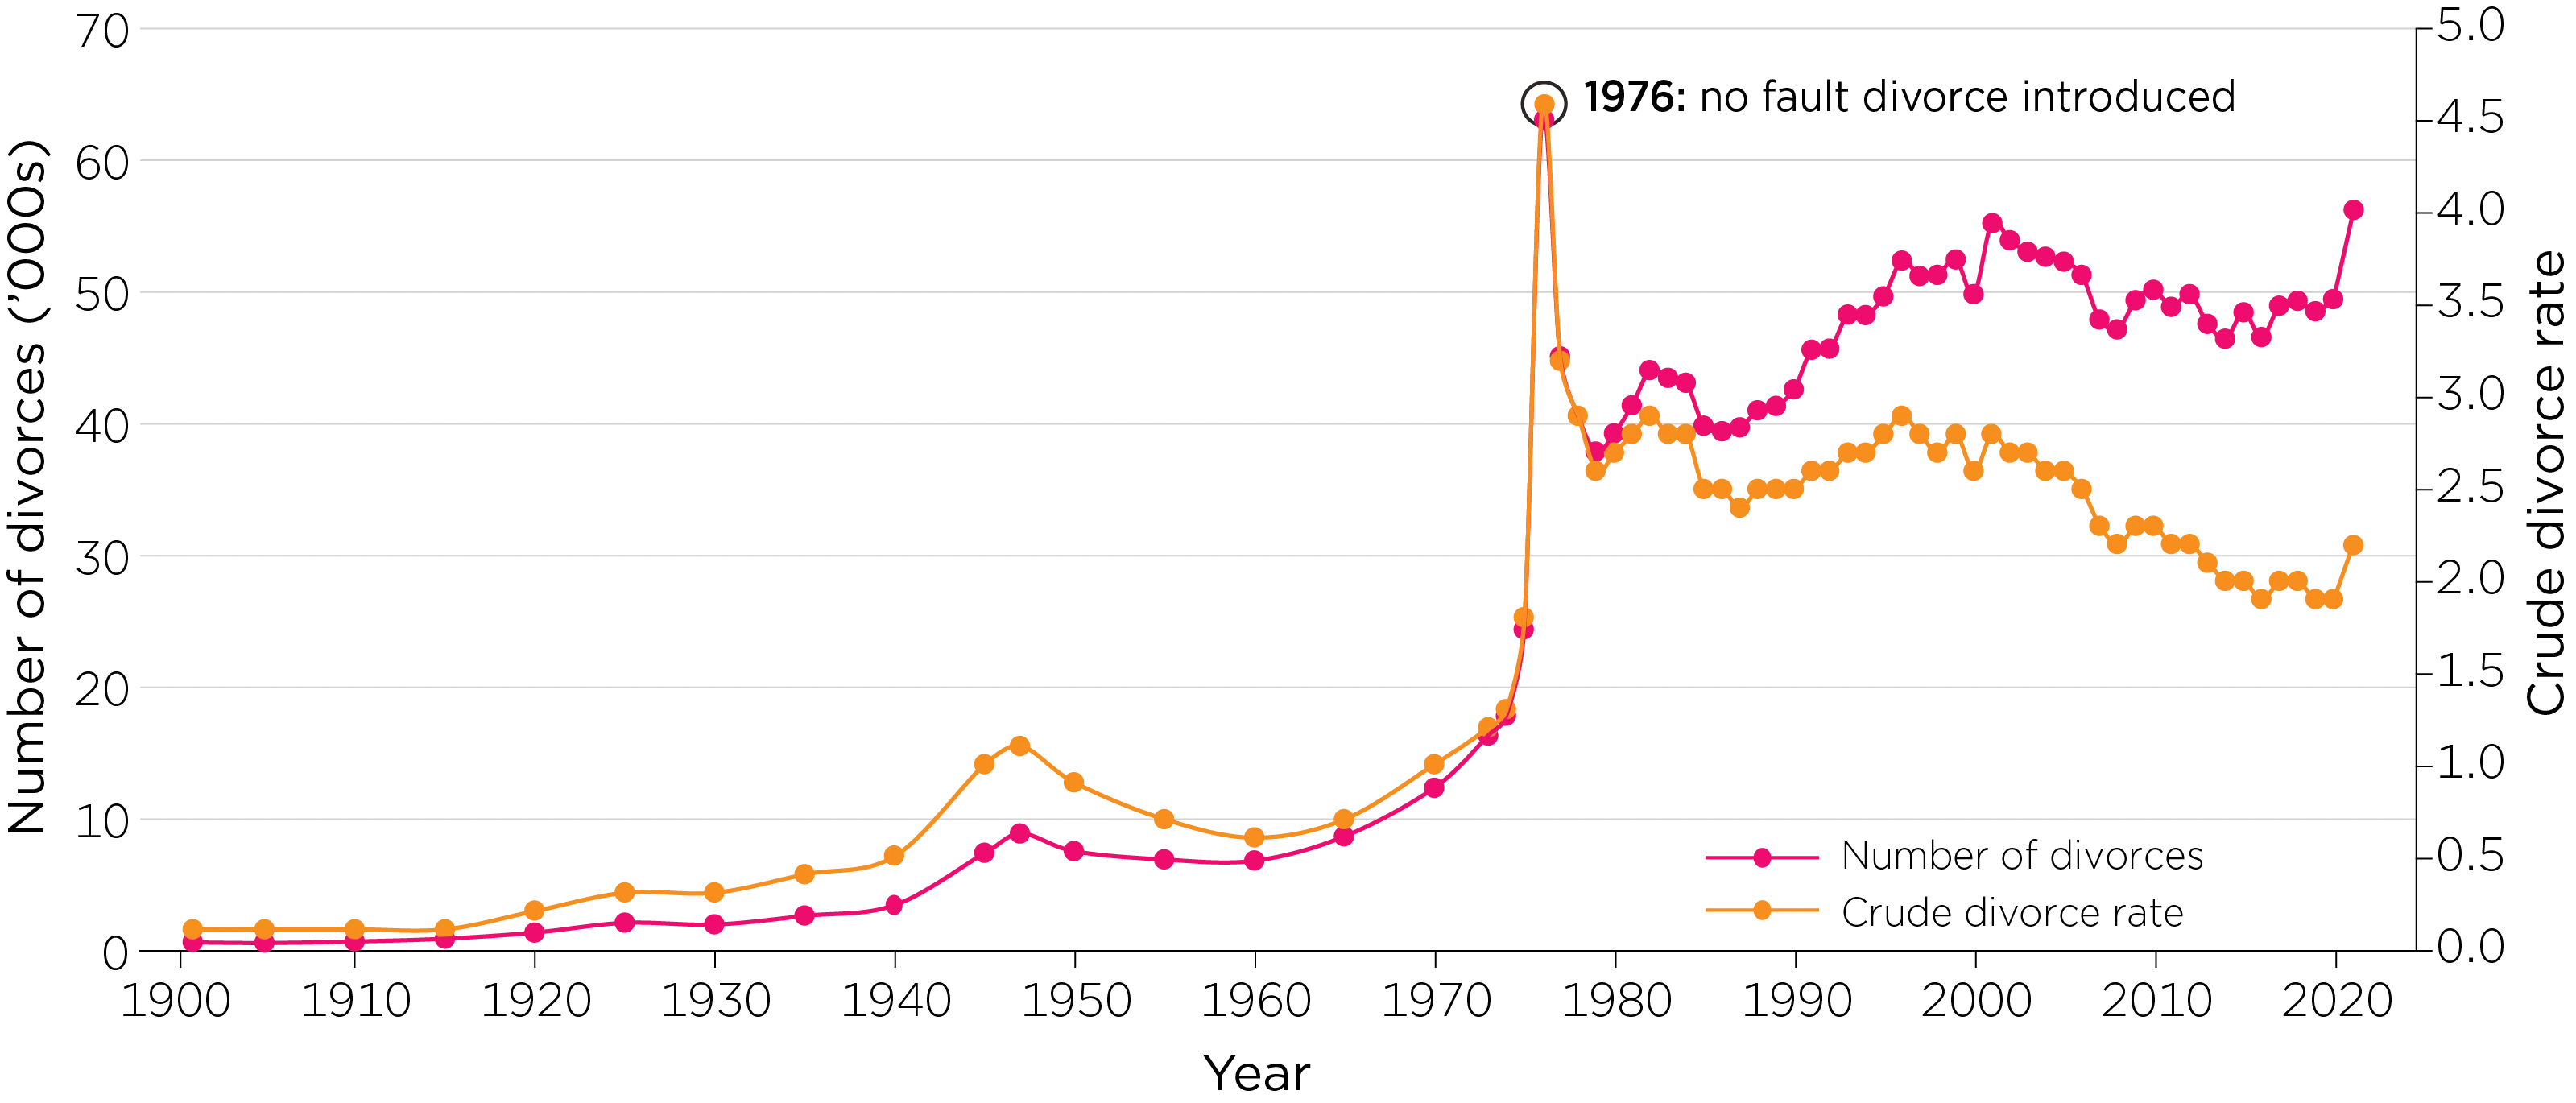
The rate climbed after no-fault divorce arrived in 1976, then settled. It has been falling for years.
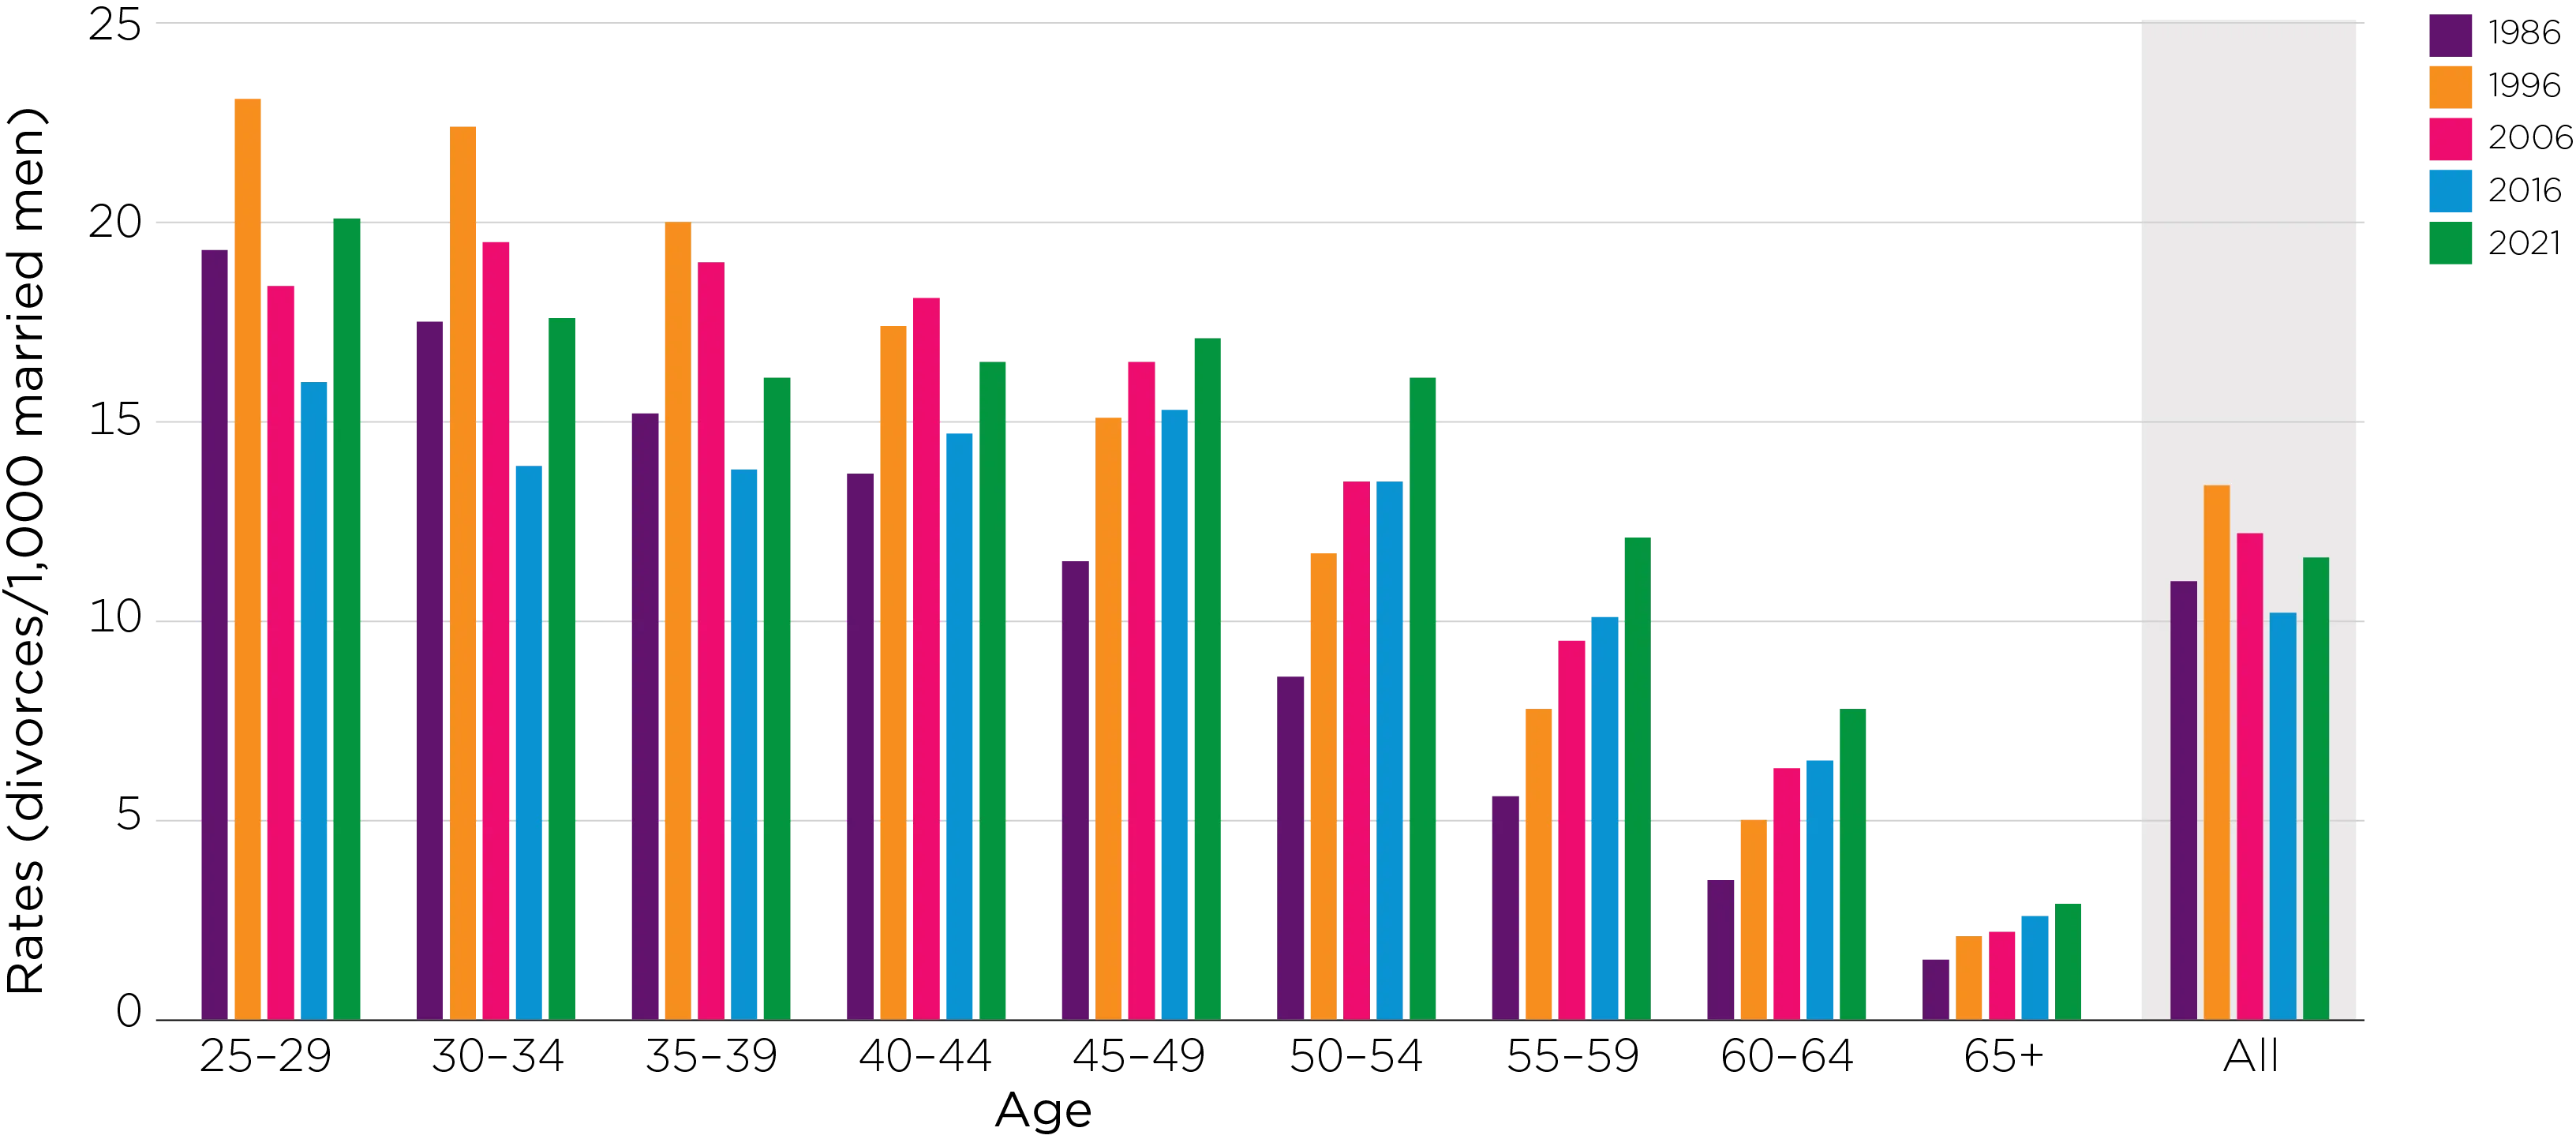
By age group (men)
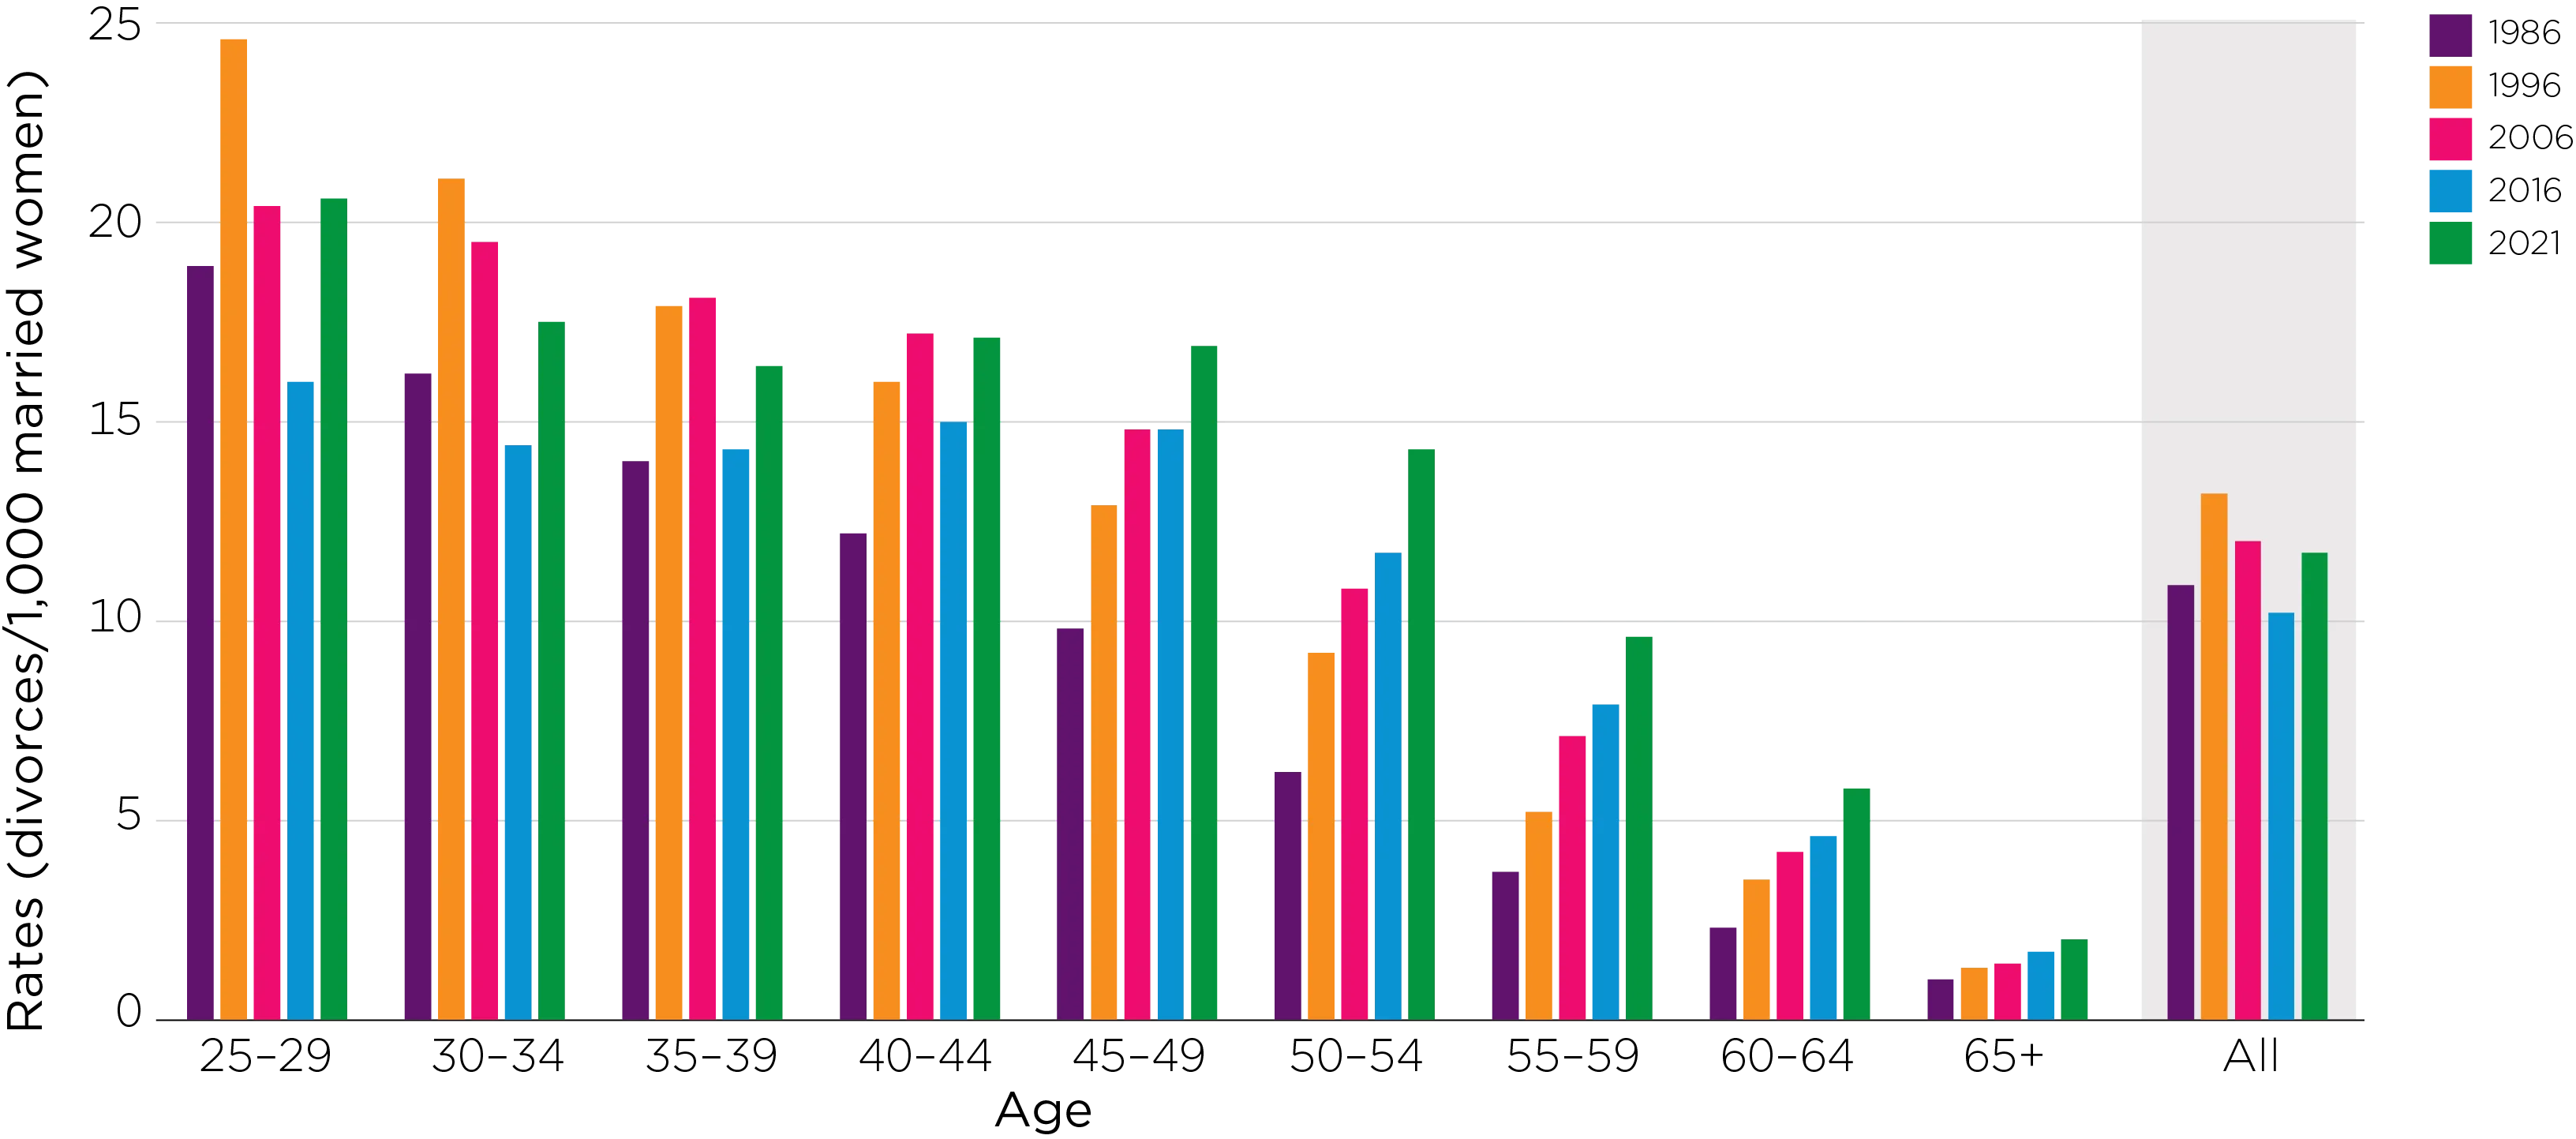
By age group (women)
What the numbers actually say
Divorce is becoming less common. The 2024 rate of 2.1 per 1,000 is the lowest since 1976, down from a peak of 4.6.
Marriages are lasting longer. The median length of a marriage that ends in divorce has risen to 13.2 years.
Most marriages last. Projections suggest about 1 in 3 marriages ends in divorce, which means roughly 2 in 3 do not.
Averages are not destiny. These figures describe the whole country. They cannot tell you what will happen in any single relationship.



More free tools
All guides and toolsIf you are going through a separation, Separately helps you understand your financial position clearly and privately, at your own pace.
Join the waitlistData sources & references
- Australian Bureau of Statistics. (2025). Marriages and Divorces, Australia, 2024.
- Australian Institute of Family Studies. Divorces in Australia.
- Australian Institute of Family Studies. Marriages in Australia.
Figures are national averages for context only. They are not advice and not a prediction about any individual relationship.